32
Molecular and Cell Biology of Autoantibodies and Autoimmunity
Table: HLA-DR and DQ typing results
HLA Antigen
Percent
68KD + MCTD
n - 20
ALL SLE
n = 38
Sm + SLE
n = 12
Sm-SLE
n = 26
Controls
n = 102
DRW52
301
76
78
75
65
DRW53
802
37
33
38
53
DR1
20
8
8
8
16
DR2
50
535
75
42
27
DR3
153
47 6
42
58
21
DR4
60 4
18
25
15
30
DR5
0
13
17
12
30
DQW1
65
74
75
73
67
DQW2
45
58
50
62
35
DQW3
65
37
50
62
60
1 p< 0.008 MCTD versus control; p< 0.004 MCTD versus SLE.
2 p<0.02 MCTD versus control; p< 0.002 MCTD versus SLE.
3 p<0.01 MCTD versus SLE.
4 p < 0.002 MCTD versus SLE; p < 0.02 MCTD versus controls.
5 p< 0.002 SLE versus controls.
6 p< 0.004 SLE versus controls.
We found no significant differences between the distribution of phenotypes
for any HLA-A, B or C antigen tested between MCTD of SLE patients and con-
trols.
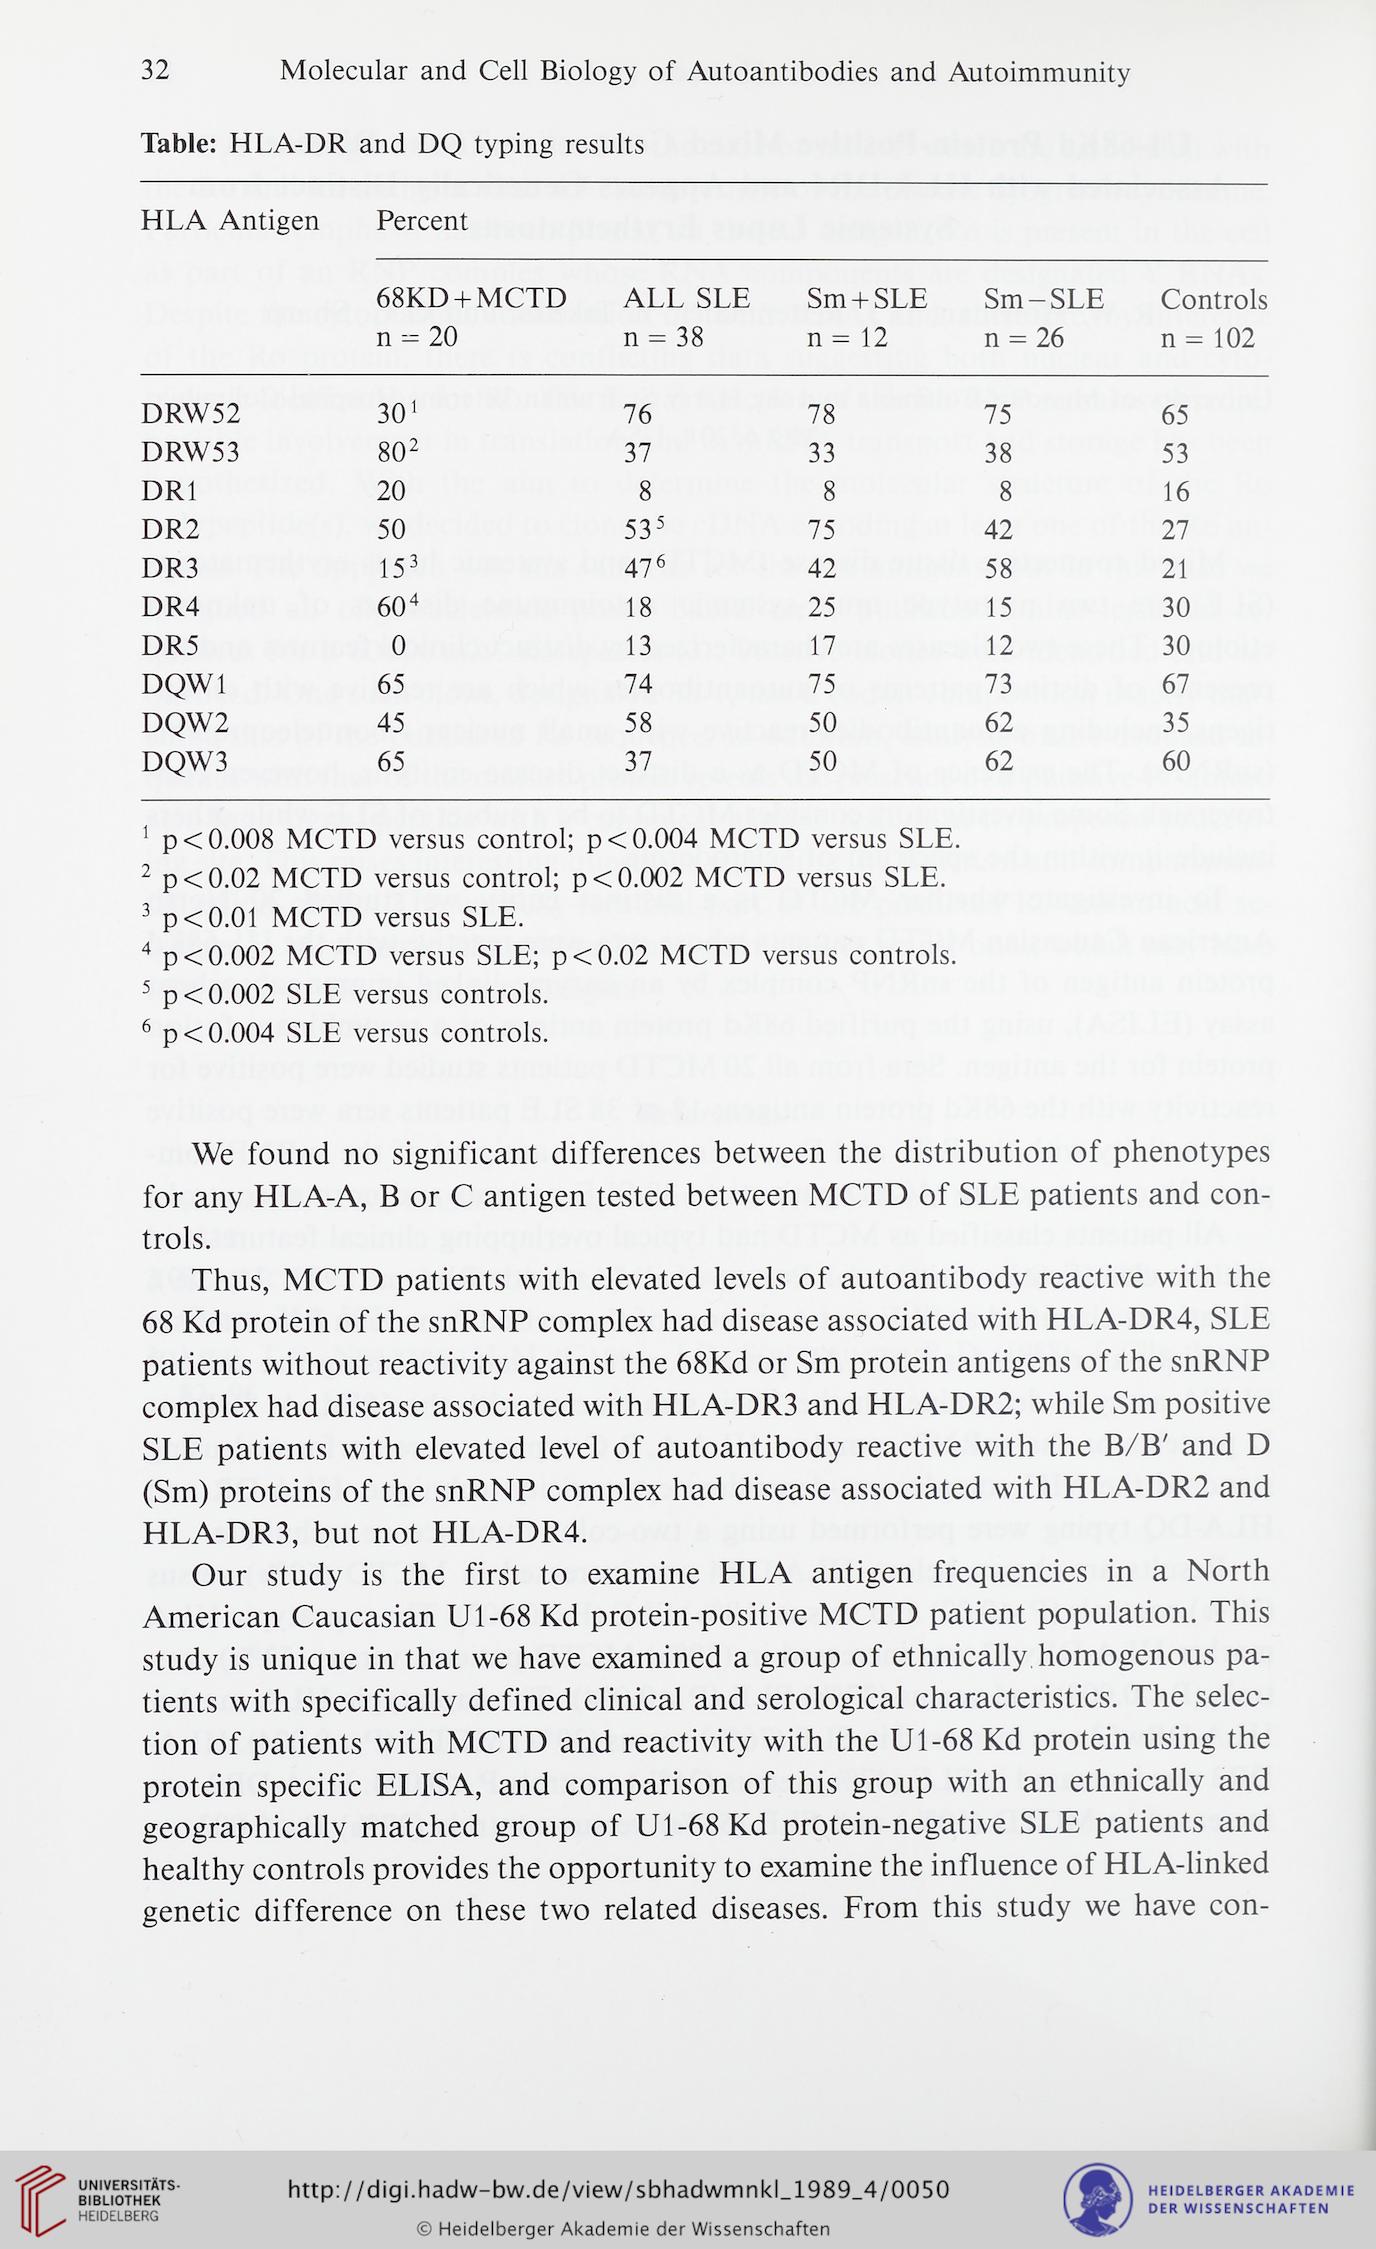
Thus, MCTD patients with elevated levels of autoantibody reactive with the
68 Kd protein of the snRNP complex had disease associated with HLA-DR4, SLE
patients without reactivity against the 68Kd or Sm protein antigens of the snRNP
complex had disease associated with HLA-DR3 and HLA-DR2; while Sm positive
SLE patients with elevated level of autoantibody reactive with the B/B' and D
(Sm) proteins of the snRNP complex had disease associated with HLA-DR2 and
HLA-DR3, but not HLA-DR4.
Our study is the first to examine HLA antigen frequencies in a North
American Caucasian Ul-68 Kd protein-positive MCTD patient population. This
study is unique in that we have examined a group of ethnically homogenous pa-
tients with specifically defined clinical and serological characteristics. The selec-
tion of patients with MCTD and reactivity with the Ul-68 Kd protein using the
protein specific ELISA, and comparison of this group with an ethnically and
geographically matched group of Ul-68 Kd protein-negative SLE patients and
healthy controls provides the opportunity to examine the influence of HLA-linked
genetic difference on these two related diseases. From this study we have con-


